14 Reasons Why Investors and Traders Trust AbleSys Signals
1. Stocks and Commodities Magazine Reader's Choice Awards for 29 years in a row
Only AbleTrend has won Stocks & Commodities magazine Readers' Choice Awards of triple trading systems for 29 years in a row, including stock trading systems, futures trading systems and option trading systems. This is no small achievement. Every year countless new trading software systems hit the market. AbleTrend has stood the test of time when others have bitten the dust. AbleSys does not make any outlandish claims - we don't have to! Our satisfied users around the world are the best prove of the AbleSys brand in the trading software industry.
2. Google search at top ranks
3. Excellent Trust Pilot rating
4. BBB A+
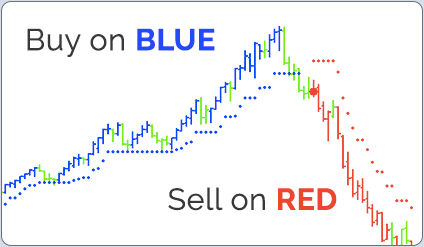
5. Time-tested Buy On Blue, Sell On Red
6. Break-Through Formula Applicable to All Markets (an impossible challenge for curve-fitting methods)
Dr. Wang's AbleTrend software reveals the universal law of the market, showing you the most probable course the market will take in the future. AbleTrend works in every market and every time frame. Beware of programs designed to trade only one particular market within a particular time interval - for instance, a system that only trades the E-mini S&P 2-minute chart. Reason: there is a very high likelihood that the program is curve-fitting the historical data. Algorithms based on curve fitting is worthless. Why? Financial markets are dynamic and constantly changing. Only algorithms based on timeless and universal market principles work in today's markets– and in all markets, all the time.
7. AbleTrend Support/Resistance (S/R) Dots - Safety Measure in Trading
8. Differentiate Retracement from Reversals with AbleSys Support/Resistance (S/R) Dots
9. AbleTrend was designed to seek profits in volatile markets with managed risk
10. For the cost of one system empowers you to trade all markets
There are trading software companies that sell their software on a module-by module basis. For example, if you trade stocks and a few different commodities, you will need to pay a fee for stocks and for each commodity. That could quickly add up to tens of thousands of dollars. However, with AbleTrend you only need to buy one system to cover all your trading needs. There is no need to shell out big bucks for a different system for each and every market you trade. AbleTrend knows no bounds; it goes wherever the profit can be found. With today’s global economy and great volatility opportunities abound.
11. Free one-on-one consultation with phone
In today’s fast changing global market environment, having a million dollars in your account does not necessarily mean security. Rather, true security comes from possessing a winning system and skills to manage your assets – profitably and prudently – especially in volatile markets like we are seeing.
To have a private consultant for building a life-time skill in managing your own financial assets could be expensive – very expensive. That is why our value-added one-on-one consultation service makes owning AbleTrend software a cannot-miss opportunity.
12. Interactive webinars once a week
13. AbleSys offers a 30-day trial
14. AbleTrend creator, Dr. John Wang, is a Quantum Physical Chemist and active trader
Dr. Wang, CEO of AbleSys, holds an M.S. in quantum chemistry and a Ph.D. in physical chemistry and he has been an active trader since 1990. Dr. Wang notes: “Fundamental natural laws not only can be applied to the natural sciences, but also work in financial markets.”


 AbleTrend Mobile (ATM)