Oscillator
Oscillator is built from MACD modifications for monitor of market directions. AbleTrend takes care of big trend directions, and the Oscillator watches trend in more details.
Default settings:
Fast length is 5.
Slow length is 21.
Usage:
Basically, the positive values mean Uptrend, and the negative value Downtrend. The AbleTrend oscillator is either blue for Uptrend or red for a Downtrend and it's at the bottom of the chart.
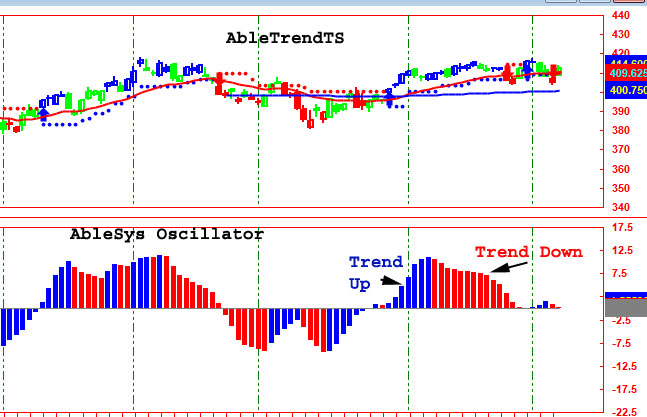
The AbleTrend oscillator is helpful to know when to get back into a trade after you have been stopped out for day trading. And, it helps to exit your trade quickly.
Day trading with 1-2-3 guidance chart, if stopped out when day trading then you may re-enter on a sweet spot which is when the price pulls back to the small blue or small red dots and then the next red or blue price bar with agreement from the 1, 2 and 3 minute signal also - meaning there is also a 2min “x" and a 3min arrow of the same color and also the oscillator is the same color as the price bar. That puts the odds of success in your favor and lowers risk. You watch the Oscillator still remaining on the same direction or not under sideways.
Developed by Gerald Appel, Moving Average Convergence Divergence (MACD) is one of the simplest and most reliable indicators available. Moving Averages are trend-following indicators that don’t work well in choppy markets. Oscillators tend to be more responsive to the choppy markets. MACD indicator combines trend and choppy characteristics. MACD basically is still a trend-following indicator.
Calculations
MACD = EMA1 – EMA2
Where,
MACD - Value of Moving Average Convergence Divergence
EMA1 – Fast Exponential Moving Average
EMA2 – Slow Exponential Moving Average
Price value is Close
Length of EMA1 is 12
Length of EMA2 is 26
Note: MACD does not support such histogram format. An error message will show. After add a MACD, please make sure all plots type is Line.
Risk Disclosure: Futures and options trading contains substantial risk and is not for every investor. An investor could potentially lose all or more than the initial investment. Risk capital is money that can be lost without jeopardizing one's financial security or lifestyle. Only risk capital should be used for trading and only those with sufficient risk capital should consider trading. Past performance is not necessarily indicative of future results.
Hypothetical Performance Disclosure: Hypothetical performance results have many inherent limitations, some of which are described below. no representation is being made that any account will or is likely to achieve profits or losses similar to those shown; in fact, there are frequently sharp differences between hypothetical performance results and the actual results subsequently achieved by any particular trading program. One of the limitations of hypothetical performance results is that they are generally prepared with the benefit of hindsight. In addition, hypothetical trading does not involve financial risk, and no hypothetical trading record can completely account for the impact of financial risk of actual trading. for example, the ability to withstand losses or to adhere to a particular trading program in spite of trading losses are material points which can also adversely affect actual trading results. There are numerous other factors related to the markets in general or to the implementation of any specific trading program which cannot be fully accounted for in the preparation of hypothetical performance results and all which can adversely affect trading results.
Testimonial Disclosure: Testimonials appearing on this website may not be representative of the experience of other clients or customers and is not a guarantee of future performance or success.
© Copyright 1995-2026 AbleSys Corporation. All rights reserved.
Privacy Statement
Address: 35111F Newark Blvd. Suite 506, Newark, CA 94560


