Ichimoku Cloud is a collection of technical indicators that show support and resistance levels, as well as momentum and trend direction. It does this by taking multiple averages and plotting them on a chart. It also uses these figures to compute a “cloud” that attempts to forecast where the price may find support or resistance in the future.
The Ichimoku Cloud was first developed by Goichi Hosoda, a Japanese journalist, in 1930s, and published in 1968. The name translates to “one glance equilibrium charts” due to the strong visual nature of the indicators.
Based on standard candlestick chart it provides more data points. While it seems complicated at first glance, those familiar with how to read the charts often find it easy to understand with well-defined trading signals.
The Ichimoku Cloud is composed of five lines or calculations, two of which comprise a cloud where the difference between the two lines is shaded in.
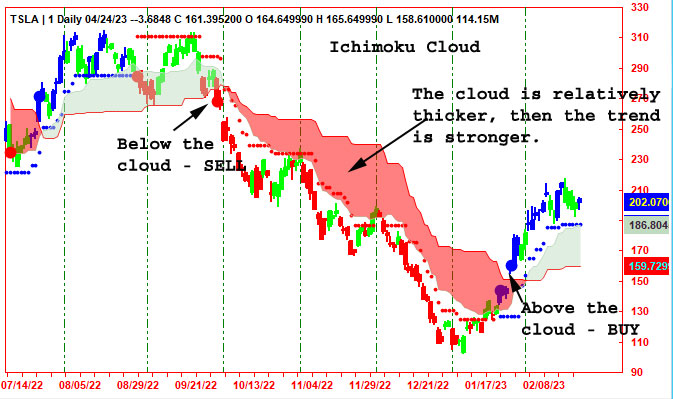
The cloud is a key part of the indicator. When the price is below the cloud, the trend is down. When the price is above the cloud, the trend is up.
The above trend signals are strengthened if the cloud is moving in the same direction as the price. For example, during an uptrend, the top of the cloud is moving up, or during a downtrend, the bottom of the cloud is moving down.
1. Conversion Line (CL, “tenkan sen”) = (9-PH+9-PL) / 2
Allow to turn ON/OFF the CL display, default is OFF. Default color Yellow. The Conversion Line (转换线) can be used with price to gauge changes in trend, although the default 9 period calculation is prone to whipsaws. Another analysis technique is to use of the Conversion Line to determine momentum. If the Conversion Line is relatively flat, then there is thought be little momentum in the market. However, if the Conversion Line’s angle is relatively steep then there is considered to be strong momentum.
2. Base Line (BL, “kijun sen”) = (26-PH + 26-PL) / 2
Allow to turn ON/OFF the BL display, default is OFF. Default color Orange. One of the common uses of the Base Line (参考线) is to use its relation to price to determine trend strength. If the price breaks the Base Line after trading away from for a prolonged period, then this is an indication that the trend is getting weak.
3. Leading Span A (LSA, “senkou span A”) = (CL + Base Line) / 2
Display - default is ON all time. Default color Green.
4. Leading Span B (LSB, “senkou span B”) = (52-PH + 52-PL) /2
Display - default is ON all time. Default color Red.
5. Lagging Span (LAG, “chikou span”) = Close price of 26 bar ago
Allow to turn ON/OFF the LAG display, default is OFF. Default color Black. You may turn this LAG line ON/OFF in case needed. Default for LAG line is not show. The most common use of LAG is to compare it to price 26 periods back. If the Lagging Span is above price at that point, then it is meant to tell us that there is not short term resistance. If the Lagging Span is below price, then it is meant to tell us that there is potential short term resistance in the near future.
where:
PH = Period high
PL= Period low
CL= Conversion line
The difference between Leading Span A (LSA) and Leading Span B (LSB) is colored in to create the cloud. the cloud itself is constructed with two indicators – the Leading Span A and the Leading Span B.
When Leading Span A is above Leading Span B, color the cloud green. When Leading Span A is below Leading Span B, color the cloud red.
Green line is greater than Red line, the cloud is green and Green line is less then Red line, the cloud is red. a green cloud indicates bullishness in the market while a red cloud indicates bearishness.
|
Indicator |
Default |
|---|---|
|
Conversion Line (Yellow, not display) |
9 |
|
Base Line (Orange, not display) |
26 |
|
Span A (Green Line, display) |
26 |
|
Span B (Red Line, display) |
52 |
|
Lead Shift to right side (Black, not display) |
26 |
Ichimoku Clouds is mainly used for trend analysis. If price is above the cloud, we have confirmation that the trend is bullish. If the price is below the cloud, then the trend is considered bearish. If price is inside of the cloud, then the trend is considered indeterminate or the market is considered to be consolidating.
The cloud can also be used to identify potential support and resistance levels. If price is above the cloud and then tests the top of the cloud, then we should watch for the cloud to offer support. Of course, if price is below the cloud and then tests the bottom of the cloud, then we should watch for the cloud to offer resistance.
The Ichimoku Cloud can also tell us about trend strength. If the cloud is relatively thin, the trend is considered to be weak. However, if the cloud is relatively thick, then classic cloud analysis would tell us that the trend is strong.
Many AbleTrend traders will use the Ichimoku Cloud in concert with other analysis techniques for trend, strength, support and resistance confirmation.
Leading Span A (LSA, Green Line) can be used as support evels.
Leading Span B (LSB, Red Line) can be used as resistance levels.
The indicator can make a chart look busy with all the lines. To remedy this, most charting software allows certain lines to be hidden. For example, all of the lines can be hidden except for Leading Span A and Leading Span B, which create the cloud. Each trader needs to focus on which lines provide the most information, then consider hiding the rest if all of the lines are distracting.
Another limitation of the Ichimoku Cloud is that it is based on historical data. While two of these data points are plotted in the future, there is nothing in the formula that is inherently predictive. Averages are simply being plotted in the future.
The cloud can also become irrelevant for long periods of time, as the price remains way above or way below it. At times like these, the conversion line, the base line, and their crossovers become more important, as they generally stick closer to the price.
Reference
Ichimoku Cloud Guide, Private manual.
Risk Disclosure: Futures and options trading contains substantial risk and is not for every investor. An investor could potentially lose all or more than the initial investment. Risk capital is money that can be lost without jeopardizing one's financial security or lifestyle. Only risk capital should be used for trading and only those with sufficient risk capital should consider trading. Past performance is not necessarily indicative of future results.
Hypothetical Performance Disclosure: Hypothetical performance results have many inherent limitations, some of which are described below. no representation is being made that any account will or is likely to achieve profits or losses similar to those shown; in fact, there are frequently sharp differences between hypothetical performance results and the actual results subsequently achieved by any particular trading program. One of the limitations of hypothetical performance results is that they are generally prepared with the benefit of hindsight. In addition, hypothetical trading does not involve financial risk, and no hypothetical trading record can completely account for the impact of financial risk of actual trading. for example, the ability to withstand losses or to adhere to a particular trading program in spite of trading losses are material points which can also adversely affect actual trading results. There are numerous other factors related to the markets in general or to the implementation of any specific trading program which cannot be fully accounted for in the preparation of hypothetical performance results and all which can adversely affect trading results.
Testimonial Disclosure: Testimonials appearing on this website may not be representative of the experience of other clients or customers and is not a guarantee of future performance or success.
© Copyright 1995-2026 AbleSys Corporation. All rights reserved.
Privacy Statement
Address: 35111F Newark Blvd. Suite 506, Newark, CA 94560


