Right click a chart, then choose Format Symbols
Click Toolbar > "S" icon
Click Menu bar > Format > Format Symbols – Global
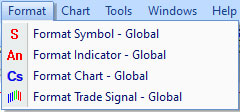
Format Symbol – Global, it means as soon as this setup, it will take over as your custom default and show next time after you start the software.
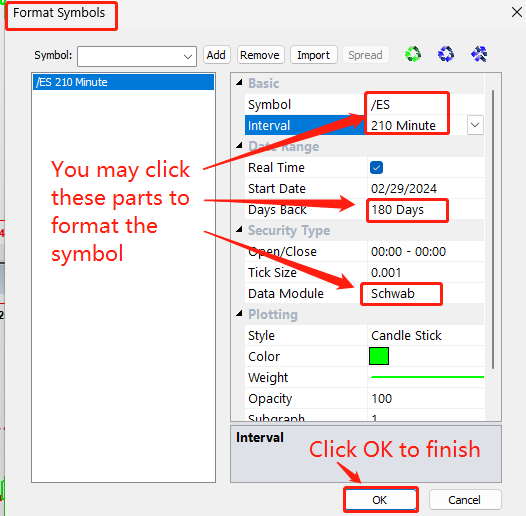
Input /ES to "Symbol" field, then press ❬Enter❭ key
Symbol – Input symbol here, you may add a few symbols to a chart. Spread – for spread symbols
Interval – See drop down menu to show choices
Date Range – Data range
Security Type - Trading Time, Tick Size, Data Module (choose your data module)
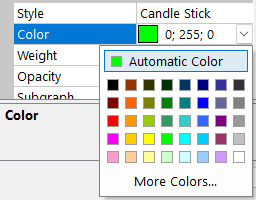
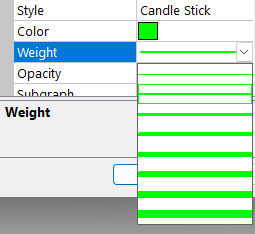
Plotting – Style (OHLC, Candelstick, Line), Color, Weight, Opacity, Subgraph (1, 2,..)
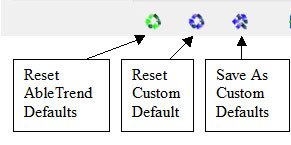
Format Symbols – Global, it means as soon as this setup, it will take over and show next time you start the software. For example, if you save custom default to use Candelstick, all charts will use Candelstick style.
Click the right ... of Interval box, dialog window will popup.
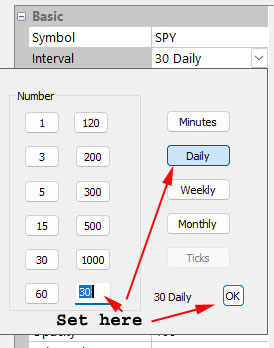
You may choose or setup time "Interval" for your chart. Here, for example, input 30, click Daily, then OK. It will setup 30 day chart.
Risk Disclosure: Futures and options trading contains substantial risk and is not for every investor. An investor could potentially lose all or more than the initial investment. Risk capital is money that can be lost without jeopardizing one's financial security or lifestyle. Only risk capital should be used for trading and only those with sufficient risk capital should consider trading. Past performance is not necessarily indicative of future results.
Hypothetical Performance Disclosure: Hypothetical performance results have many inherent limitations, some of which are described below. no representation is being made that any account will or is likely to achieve profits or losses similar to those shown; in fact, there are frequently sharp differences between hypothetical performance results and the actual results subsequently achieved by any particular trading program. One of the limitations of hypothetical performance results is that they are generally prepared with the benefit of hindsight. In addition, hypothetical trading does not involve financial risk, and no hypothetical trading record can completely account for the impact of financial risk of actual trading. for example, the ability to withstand losses or to adhere to a particular trading program in spite of trading losses are material points which can also adversely affect actual trading results. There are numerous other factors related to the markets in general or to the implementation of any specific trading program which cannot be fully accounted for in the preparation of hypothetical performance results and all which can adversely affect trading results.
Testimonial Disclosure: Testimonials appearing on this website may not be representative of the experience of other clients or customers and is not a guarantee of future performance or success.
© Copyright 1995-2026 AbleSys Corporation. All rights reserved.
Privacy Statement
Address: 35111F Newark Blvd. Suite 506, Newark, CA 94560


