Common icons. Use mouse point the icons, a text box will popup next to the icon, and tells what is. Feel free to play, and get familiar.


There are four ways to create a new chart window:
Set up a chart by clicking "New Chart" icon "S",
Clicking "Insert", "Symbol" menu.
Simply press "Ctrl-N" keys.
From File > New Chart… Type in the symbol name, such as IBM. Choose time interval (such as 30-min), or daily, or weekly etc., then click OK button.
You mat set up date range for back testing purpose.
After the chart shows up, you may simply click the "STM" icon on the Toolbar. It will apply AbleTrend1 (AT1) and AbleTrend2 (AT2) indicators with default settings to a chart. This is the "Buy On Blue" and "Sell On Red" trading method.
You may also click the "An" icon, the add indicator window will pops up.
Simply add AbleTrend1, AbleTrend2 … to the chart.
The blue dots are Buy signals and the red dots are Sell signals. You will hear sound alert and see the Alert Window popping up when there is a buy or sell signal.
Click anywhere of a chart and select a chart. Click the "An" icon, the Indicator Setting window will pop up.
Select an indicator, such as AbleTrend1.
Click "Add".
Change "Parameter" settings
Change "Style ", "Weight ", "Color " and "Subgraph " settings.
Click "OK" button.
You may add the same indicator to the same chart a few times with different settings.
There are two ways to use drawing tools.
From Menu bar > Chart > Drawing Tools….
From Menu bar > View > Check Drawbar… It will show the icons Drawing Tools
The "Drawing" tools allow you to draw TrendLine, Text, Vertical Line, Horizontal Line, %R, etc. on a chart.

The icons are listed in the order of Pointer, Select Wizard, PointMark, Cross, Text, Up-Arrow, Down-Arrow, Line, TrendLine, Horizontal Line, Vertical Line, %R, PointMark, Square, Circle, Erase, Erase All.
Pointer – Default pointer
Select Wizard – Use it to select an item, such as a symbol chart, or an indicator, or text, or TrendLine etc…
PointMark – drawing a point mark
Cross – drawing a cross mark
Text – drawing text
Up-Arrow – drawing an up-arrow
Down-Arrow - drawing a down-arrow
Line – drawing a line defined by two points
TrendLine – drawing a TrendLine defined by two points
Horizontal Line - drawing a horizontal line defined by two points
Vertical Line - drawing a vertical line defined by two points
%R – Percent Retracement. Click a low point, then click a high point, and finally click a point in between, %R will show. Or, Click a high point, then click a low point, and finally click a point in between, %R will show.
Radical – drawing a line from a line
Square – drawing a rectangle or square
Ellipse – drawing a circle or ellipse
Erase – Use this tool to erase an item, such as a symbol chart, an indicator, ATTS, a drawing etc.
Erase All – Erase all items in a chart.
There are five (5) ways to resize a chart in AbleTrend software.
Click Zoom-In or Zoom-Out icon from "ResizeBar"
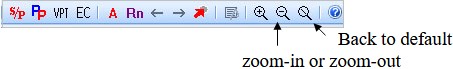
Click Menubar > Zoom-In or Zoom-Out. Or roll mouse wheel forward or back.
Turn mouse wheel to zoom-in or zoom-out
First click "Pointer", then press Ctrl key and drag the mouse to select the zoom of a chart.
Press left mouse and drag the chart to move to right or left.
To show Resizebar, click View > Resizebar… You may arrange the Resizebar to the top, left or right side of the screen.
Click "Original" icon to set the chart size back to default.
To custom setup default chart size: See Chart Custom Setup.
There are two types of Virtual Paper Trading (VPT) that give traders great power and flexibility for testing strategies: Virtual paper trading with historic data and Virtual paper with real-time data.
Virtual Paper Trading with historic data
Traders can validate their trading strategy with historic data that goes beyond back testing reports. Traders can choose which indicators they want to include in their strategy and they can set the rules they want to use to interpret the indicators. They can use subjective indicators alone using the Classic configuration of AbleTrend or they can combine subjective indicators with the mechanical trading system in the Deluxe Plus configuration. No other software gives you such power: subjective indicators, mechanical trading system, and the means to perform virtual paper trading. The trader right clicks on a bar and clicks on VPT at This Bar to load the VPTBar.
Virtual Paper Trading with real-time data
Traders can experience real-time virtual paper trading to closely simulate real-time trading without risking any money. This can be very effective with subjective indicators, the mechanical trading system, or a combination of both. The trader right-clicks on the last bar of a chart and clicks on VPT at This Bar to load the VPTBar.
How to do VPT?
Go to any chart, click “VPT” icon at Toolbar.
Or, from Tools > VPT
The VPTBar will pop-up
The items on the VPTBar are in order of Stop, Play, Speed, Buy, Sell, Exit, Re-do, Re-set, C/B, Setting, Report (Exit)
Stop – stop the bar coming
Play – start to simulate the bar’s coming.
1s Speed – setup the bar coming speed, 1 second to 10 seconds per bar
B Buy – place buy order by clicking a bar, mark a blue up-arrow
S Sell – place sell order by clicking a bar, mark a red down-arrow
E Exit – place exit order by clicking a bar, mark a white cress
Re-do – re do the last trade
Re-set – reset the VPT again, start over
C/B – Default is entry at bar close. Click V/B icon, it will switch to Bid/Ask price, or any specific price on the bar (what you click, what will be the price to enter or exit)
Setting – setup ContractSize, CostPerTrade, and PointValue
Report – show VPT testing report. Close the report, it will exit the VPT. Trade by Trade
You may customize icons, toolbar, drawingbar, menu etc. by click the View > Toolbar …
Risk Disclosure: Futures and options trading contains substantial risk and is not for every investor. An investor could potentially lose all or more than the initial investment. Risk capital is money that can be lost without jeopardizing one's financial security or lifestyle. Only risk capital should be used for trading and only those with sufficient risk capital should consider trading. Past performance is not necessarily indicative of future results.
Hypothetical Performance Disclosure: Hypothetical performance results have many inherent limitations, some of which are described below. no representation is being made that any account will or is likely to achieve profits or losses similar to those shown; in fact, there are frequently sharp differences between hypothetical performance results and the actual results subsequently achieved by any particular trading program. One of the limitations of hypothetical performance results is that they are generally prepared with the benefit of hindsight. In addition, hypothetical trading does not involve financial risk, and no hypothetical trading record can completely account for the impact of financial risk of actual trading. for example, the ability to withstand losses or to adhere to a particular trading program in spite of trading losses are material points which can also adversely affect actual trading results. There are numerous other factors related to the markets in general or to the implementation of any specific trading program which cannot be fully accounted for in the preparation of hypothetical performance results and all which can adversely affect trading results.
Testimonial Disclosure: Testimonials appearing on this website may not be representative of the experience of other clients or customers and is not a guarantee of future performance or success.
© Copyright 1995-2026 AbleSys Corporation. All rights reserved.
Privacy Statement
Address: 35111F Newark Blvd. Suite 506, Newark, CA 94560


